
Freeport targets higher sales volume this year
Thursday, January 26 2017 - 01:51 AM WIB

US-based Freeport McMoRan Copper & Gold Inc has set higher sales volume target for this year from its Indonesian operations run by subsidiary PT Freeport Indonesia (PT-FI), but this would among others depend on whether the latter company could obtain the necessary export permit from the Indonesian government on time.
Freeport said in a statement on Wednesday that consolidated sales volumes from Indonesia mining operations (assuming normal operations, including the resumption of concentrate exports in February 2017 and the renewal of PT Smelting?s export license) are expected to approximate 1.3 billion pounds of copper and 2.2 million ounces of gold for the year 2017, compared with 1.05 billion pounds of copper and 1.05 million ounces of gold targets for the year 2016.
The company said Indonesia mining?s projected sales volumes are dependent on a number of factors, including operational performance, the timing of shipments and its ability to continue to export copper concentrate.
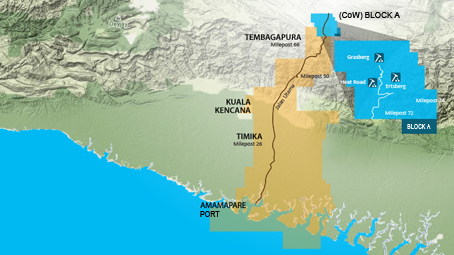
?For each month of delay in obtaining approval to export, PT-FI?s share of production is projected to be reduced by approximately 70 million pounds of copper and 100 thousand ounces of gold,? the company said in the statement unveiling the fourth quarter 2016 operating performance of its Indonesian operations at the Grasberg mine in Papua Province.
The Indonesian government has recently introduced new Government Regulation No 1/2017, allowing mineral mining firms to continue export of mineral concentrates for another five years including copper concentrates produced by PT Freeport under certain conditions including requirement for the firms to convert their permit status from mining contract of work (or KK) to special mining business license (or IUPK), commitment to develop domestic smelters, and pay export duty.
Elsewhere, Freeport reported Indonesia?s consolidated sales of 352 million pounds of copper and 401 thousand ounces of gold in fourth-quarter 2016 were higher than fourth-quarter 2015 sales of 195 million pounds of copper and 333 thousand ounces of gold, primarily reflecting higher ore grades.
Indonesia?s fourth-quarter 2016 sales were below October 2016 estimates by approximately 120 million pounds of copper and 190 thousand ounces of gold, principally reflecting lower mining rates in the Grasberg open pit, which affected the timing of its copper and gold production resulting in a deferral of volumes to future periods. Various initiatives are under way to improve productivity levels in the open pit.
At the Grasberg mine, the sequencing of mining areas with varying ore grades causes fluctuations in quarterly and annual production of copper and gold.
Freeport said a significant portion of PT-FI?s costs are fixed and unit costs vary depending on production volumes and other factors. Indonesia?s unit net cash costs (including gold and silver credits) of $0.65 per pound of copper in fourth-quarter 2016 were lower than unit net cash costs of $1.09 per pound in fourth-quarter 2015, primarily reflecting higher sales volumes.
Anticipated higher ore grades from the Grasberg mine are expected to result in lower unit net cash costs in 2017. Assuming an average gold price of $1,200 per ounce for 2017 and achievement of current sales volume and cost estimates (assuming normal operations), unit net cash credits (net of gold and silver credits) for Indonesia mining are expected to approximate $0.03 per pound of copper for the year 2017. Indonesia mining?s unit net cash credits for the year 2017 would change by approximately $0.075 per pound for each $50 per ounce change in the average price of gold. Because of the fixed nature of a large portion of Indonesia?s costs, unit costs vary from quarter to quarter depending on copper and gold volumes.
| Indonesian Mining Operations | Three Months Ended December 31, |
Years Ended December 31, |
||
| 2016 | 2015 | 2016 | 2015 | |
| Copper (million of recoverable pounds): | ||||
| Production | 369 | 201 | 1,063 | 752 |
| Sales | 352 | 195 | 1,054 | 744 |
| Average realized price per pound | $ 2.48 | $ 2.14 | $ 2.32 | $ 2.33 |
| ? | ||||
| Gold (thousands of recoverable ounces): | ||||
| Production | 424 | 345 | 1,061 | 1,232 |
| Sales | 401 | 333 | 1,054 | 1,224 |
| Average realized price per ounce | $ 1,174 | $ 1,066 | $ 1,237 | $ 1,129 |
| Unit net cash costs per pound of coppera | ||||
| Site production and delivery, excluding adjustments | $ 1.50 | $ 2.40 | $ 1.63 | $ 2.39 |
| Gold and silver credits | (1.34) | (2.87) | (1.30) | (2.91) |
| Treatment charges | 0.27 | 0.31 | 0.28 | 0.31 |
| Export duties | 0.09 | 0.10 | 0.09 | 0.15 |
| Royalty on metals | 0.13 | 0.15 | 0.13 | 0.15 |
| Unit net cash (credits) costs | $0.65 | $ 1.09 | $ 0.83 | $ 1.09 |
| a. For a reconciliation of unit net cash costs per pound to production and delivery costs applicable to sales reported in FCX?s consolidated financial statements, refer to the supplemental schedules, ?Product Revenues and Production Costs,? beginning on page XV, which are available on FCX?s website, fcx.com. | ||||
Editing by Reiner Simanjuntak